Tutorial
This case introduces the basics of expected utility models, building up from a coin flip bet to a simple retirement plan. This will allow us to get acquainted with the features of the calculator along the way.
You may have heard the advice that portfolio risk should decrease as you age. While there are legitimate reasons for such advice, some commonly heard arguments are suspect. Our expected utility model will display this property; we will try to understand why.
Coin flips and step functions
Imagine you want to buy some item for yourself, say a fancy watch priced at 10’000$. You have a fancy watch budget you’ve been saving into. There are no items other than this fancy watch that you would like to spend this budget on. Finally, you have to act fast: the fancy watch will sell out by the end of the day. Waiting to save more money is not an option.
What should you do in this situation? It all depends on the size of your fancy watch budget. If you’d saved more than 10’000$, you can go ahead and get the watch. If you didn’t, tough luck. If we drew how happy we are with our watch-buying as a function of how much money we have, it might look like this:
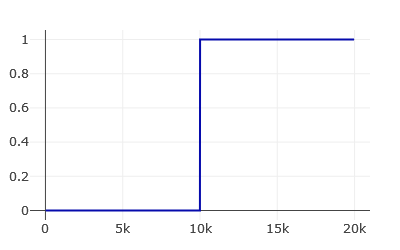
This idea of how happy we are as a function of money is called the utility of money.
Now what if on this fateful day I offered you to place a coin flip bet with your watch budget? Heads you double it, tails you lose it. What should you do?
- If you have more than 10’000\$ saved, you should not take the bet and simply buy the watch as before. There is no benefit to playing: you would go from being certain to afford the watch to having only a 50% chance.
- If you have between 5’000\$ and 10’000\$, you should take the bet. Without the bet you are sure to miss out on the watch, while with the bet you now have a 50% chance to afford it.
- Below 5’000$ it doesn’t matter whether you take the bet or not: you will surely be watchless.
Here is how this decision looks like in the calculator. Let’s take a closer look at some of the UI elements.

The strategies form allows us to specify our investment options, in this case to take or not to take the coinflip bet. To do this we specify the return distributions of our strategies. If we do not take the bet, nothing will happen, i.e. a guaranteed return of 0%. If we do, we have a 50% chance of losing everything (-100% return) and a 50% chance of doubling our money (+100% return). We specify this in terms of some dirac deltas which get plotted below the input box.
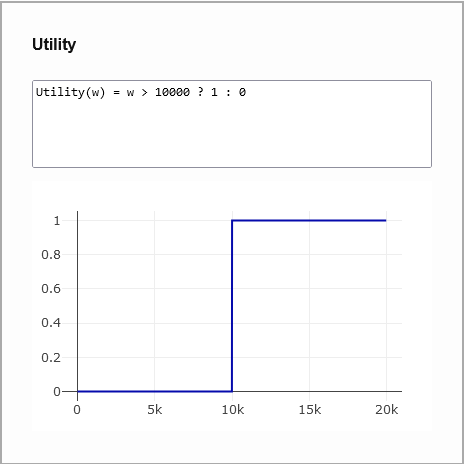
In the utility form, we recognize our step utility function expressed in terms of a ternary conditional operator.

This Liechstenstein flag looking thing is the policy map calculated for this problem. For each possible size of our watch fund (wealth), the strategy maximizing the utility function is displayed: above 10’000\$ we should not take the coinflip (blue), between 10’000\$ and 5’000\$ we should (red). Below 5’000\$ both strategies have the same expected utility, namely 0, which yields no clear choice. This ambiguity is resolved by filling in with the strategy directly above, i.e. taking the coinflip bet (red).

Hovering over an area of the policy map brings up a tooltip with the name of the optimal strategy, the expected utility, and risk of ruin for the specific point. As expected, with a wealth of 7’350\$ we are choosing to bet on the coinflip, have a 50% chance of achieving our goal (Utility=0.5) and a 50% chance of losing it all (Risk of ruin = 50%).
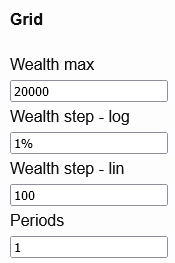
The grid form on the left defines
- the range of wealth values for which the policy map is computed, in this case $[0,20000]$
- how finely the wealth range is discretized. Linear steps are used for low wealth values, logarithmic ones for high values. The switch occurs when the logarithmic steps become larger than the linear ones. In this example, between $[0,10000]$, wealth is discretized into intervals of size $100$. Above $10000$, $1\%$ of the value is greater than $100$, so we switch to logarithmic steps: the discretization goes roughly $10000 * [1,1.01,1.01^2,1.01^3,1.01^4,…]$ from there, starting with steps of 100 and getting bigger. Hover over the policy map and slowly move your cursor to observe the spacing.
- the number of times we get to choose from and execute our strategies, indicated as “Periods”. In this example, we looked at a single coinflip bet, hence “Periods” is 1.
Interlude
Congratulations! You now understand most of what this calculator does: for each value of wealth consider each possible strategy and pick the best one, with “best” being defined as maximizing the expected value of the utility function. In a moment we’ll see how, with just a few tweaks, we can go from this contrived scenario to something much closer to real-life financial planning. For now, a few comments on what we just covered.
In making our decision on when to bet or not, our utility function is doing a lot of heavy lifting. Without it, we would have no grounds on which to choose one way or the other: maybe you enjoy gambling, maybe you think it’s a terrible sin, maybe you need the money to pay for rent, and so on. By considering our options with a clear and quantified goal in mind, i.e. buying the watch, we go from an unanswerable question (In general, should you bet on coin flips or not?) to one simple enough we can program a computer to solve. To know what to do, you must know what you want.
Step functions are good for representing all-or-nothing goals, but are by no means the only type of utility function you may want to use. A discussion of other popular choices and their properties deserves an article of its own. For now we will continue using step-function utility - you can get surprisingly far with just that.
Before going further, we should also constrast this line of reasoning with the famous mean-variance framing of modern portfolio theory. In the mean-variance world, variance of returns is always to be minimized for a given level of expected returns. The coinflip bet has high variance and no additional expected return over not playing, so it would never be picked by a mean-variance optimizer. Our step-utility optimizer, however, is perfectly happy to sometimes pick it out of a logic of desperation: the safe path (not playing) is guaranteed to fail, therefore anything else is equal or better. In fact we would have been happy to pick a coinflip even with much worse than 50/50 odds, as long as there was even a slim chance of success.
Multiple periods
What if instead of a single coinflip bet, I offered you the chance to play up to two times in a row?
If you have a chance to double your money twice, the minimum starting ammount you need to have a chance of getting to 10’000\$ shifts from 5’000\$ to 2’500\$. The optimal strategy becomes
- If you have more than 10’000\$, play 0 times for a success rate of 100%
- If you have between 5’000\$ and 10’000\$, play once for a success rate of 50%
- If you have between 2’500\$ and 5’000\$, play twice for a success rate of 25%
- Below 2’500$, you will fail no matter what
To get this result from the calculator, we change “Periods” from 1 to 2. Here is what that looks like.

Here we see our first use of the X axis to represent time. To represent the notion of playing up to two times in a row, time is broken up into two periods. In each period we have the choice to either play or not play, i.e. pick the “bet” or “no_bet” strategy, based on our current wealth. The decision rule shown in the policy map above reads:
- In the first period, only bet if your have less than 5’000\$
- In the second period, only bet if your have less than 10’000\$
Taken together, these rules produce the optimal strategy mentioned above.
Switching distributions
Most of us don’t go around betting our life savings on coinflips. What does our original single-period problem look like if, instead of choosing between coinflip or no-coinflip, we consider instead whether to put our money into a safe or a risky portfolio for a year, with the same goal of reaching 10’000\$ at the end? For concreteness sake, let’s consider a 1-year sovereign bond in your currency of choice vs a diversified stock portfolio.
Here is one way you could model it: the bond guarantees a 1% return, while equity returns are normally distributed with 5% expected return and 20% volatility.
This switch modifies the expected utility below 10’000\$: instead of a sharp step from 50% to 0% at 5’000$ in the coinflip case, there is now a continuum of odds. The decision boundary between the safe and risky strategy, however, remains almost the same: our policy map is still the flag of Liechstenstein.
The same logic as in the coinflip case applies: above ~10’000\$ (9’900\$ due to the 1% bond return) you are still guaranteed success with the safe strategy. Below, the safe strategy still guarantees failure, and you are forced into the risky option.
Keep this general pattern in mind as we now increase our number of periods and introduce cashflows into the mix.
Retirement as not going broke
The idea of retirement is financially pretty straightforward: you save and invest until you have enough that you can likely live off your assets until your death without running out.
Here is what this might look like. Let’s take a look at the cashflows form, which we’ve so far ignored.
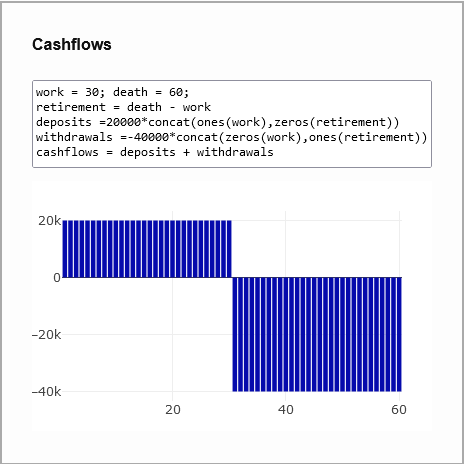
Cashflows allow us to represent saving and spending. In this example, we have a little MathJS script to initialize an array of 30 repeats of +20’000\$ followed by 30 repeats of -40’000\$, corresponding to 30 years (periods) of savings until retirement followed by 30 years of withdrawals in retirement.
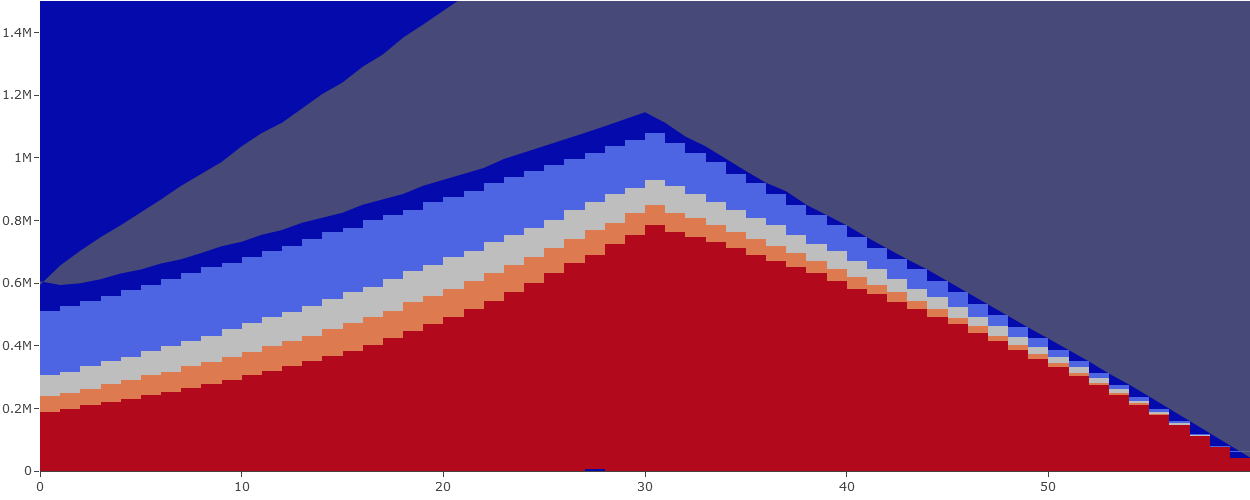
The rest of the inputs should be familiar: a step function utility at 0\$ represents the goal of not going broke by the end of the 60 planned periods. The bonds and equities strategies are as before.

As in our previous example, the safe strategy is only picked once it is guaranteed to succeed: hovering over any blue area shows an expected utility of 1. The peak of the red area at ~1M\$, period 30 corresponds to the wealth necessary at retirement to sustain 30 years of 40k withdrawals given a 1% interest rate. The stairs pattern on the left corresponds to savings: starting in period 0 with ~250k, depositing 20k for 30 periods while earning 1% will have you following the staircase and guarantees reaching ~1M in period 30. Same logic on the right with withdrawals.
When you assume…
As we switch from coinflips to financial planning, some extra scrutiny into our modelling assumptions is warranted. The key topics on which we have made assumptions in the above are strategy returns and lifecycle saving/spending. How realistic are they?
One elephant in the room is inflation. Assuming that your local central bank manages to keep ~2% annual inflation over your lifetime the purchasing power of your currency will drop by a factor of ~3 over 60 years. That’s a dramatic change, but dealing with it in our model is not as difficult as it may first seem. Inflation has the nice property that most everything in the economy moves with it - wages, cost of living, interest rates, stock returns. By reinterpreting our cashflows and policy map Y-axis to be denominated in inflation adjusted units rather than nominal ones we can largely handwave this away. On the strategies side, this means adjusting our return expectations from nominal to real returns. This mostly means cutting back expected returns by a few percent, as well as introducing some extra variance across the board. Sovereign bonds are only risk-free in the nominal sense, and even an inflation-indexed bond might not accurately reflect the basket of goods that you intend to consume: truly risk-free assets simply don’t exist.
With inflation out of the way, what about the assumption of normal returns? A fair bit has been written in recent decades about how asset returns are rarely normal/lognormal but rather fat-tailed, skewed, autocorrelated, and generally ill-behaved. While this is true, deviations from normality are most dramatic when considering individual assets and short timescales, e.g. a single stock’s daily returns. When considering yearly returns of a broadly diversified portfolio, as we are here, the departures are less concerning. If you are still not reassured you can Bring Your Own Distribution - the calculator does not rely on normality. The distribution must stay constant over time though.
The most fragile assumptions are on the cashflows side: uncertainty about the cashflow values themselves and their lack of correlation with strategy returns.
How much will you earn and spend 5, 10, 15, 30, 50 years from now? Population averages show a peak of income and savings in middle age, with an offset peak of spending happening around retirement. These are only averages, and your mileage will vary.
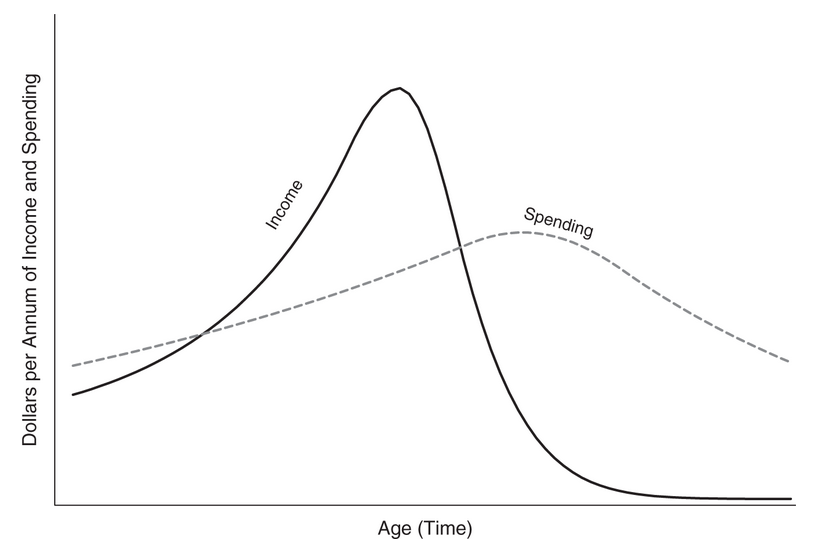 Figure shamelessly stolen from Haghani and White’s “The Missing Billionaires” chapter 13
The simplistic constant savings and deposits we’ve used don’t capture even this average picture, but nothing stops you from crafting a more bespoke array of cashflows. For tutorial purposes what we’ve seen is enough.
Income <-> investment return correlations are more discreet but just as important. In a nutshell, when the stock market crashes you are more likely to lose your job or see your pay reduced. This double whammy can be financially devastating and the correlations driving it are not captured by the model. If your industry is strongly correlated to the broader economy and/or goes through boom-bust cycles (talking to you fellow tech workers) you should be wary of this: diversify your portfolio away from your day job, be conservative in your spending and savings expectations, etc… If you are a doctor, tenured professor or work for the government this is less concerning to you.
With these caveats out of the way, let’s finish our tour of the calculator.
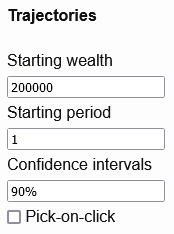
Trajectories
So far we’ve hovered over the policy map to determine our expected utility/risk of ruin from any given (wealth,period) starting point. This is useful, but only gives a limited view into where we will end up - broke or not - and no hint as to how we will get there. To paint a richer picture the calculator allows to draw out trajectories from a selected starting point.
Here is what that looks like.
 Initial capital of 200k, 90% confidence interval
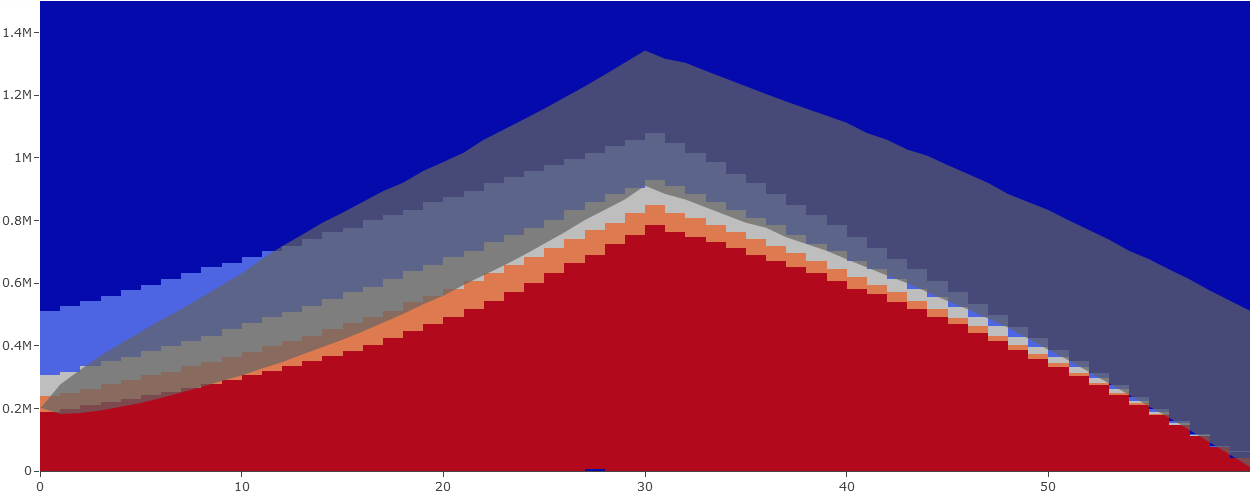
Intermediate strategies have been added between bonds and equities, resulting in more colors. The trajectories form has been filled to grey out the area within which we have a 90% chance of being at any given period when starting from 200k$ in the first period.
Finally, the utility form updates to also display the terminal probability distribution of wealth when starting from our specified point.
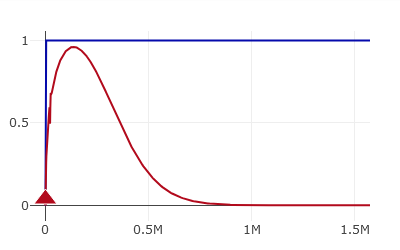
Utility in blue, terminal probability distribution in red.
This concludes our tour of the calculator features.
We now have all the tools in hand to answer our original question: why should portfolio risk decrease as you age? One answer is that it doesn’t have to! If you have no desire to leave behind wealth to your heirs and your saving/spending plan can be achieved with modest returns given your initial capital, staying in cash-like assets your whole life can be perfectly reasonable.
Here is someone who will not need to take investment risk with 99.9% confidence.
 Initial capital of 600k, 99.9% confidence interval
However if your planned saving and spending is not achieveable with low risk investments given your starting capital, you are forced into riskier options - just as in our coinflip example. One key difference between retirement and coinflips is that the riskier options also come with higher expected returns. As a result, you can reasonably hope that by staying invested in risky assets for long enough you will eventually “climb out” of the risky area of the policy map and into the safe area. This is exactly what we see in our first trajectory example, repeated below: starting at 200k period 1 we will be invested in the 75% equities portfolio. As time goes on the 90% confidence intervals shifts up to mostly be over the 25% equities and bonds portfolios at period 30, and finally fully in the bond portfolio by period 60. While we’ve been forced to take a significant ammount of investment risk over these 60 years, our odds of success are ~96% for a retirement portfolio we’ve put 800k in and withdrawn 1200k from.
Initial capital of 200k, 90% confidence interval
A more extreme example, a half-funded retirement with no initial capital eventually climbs out with 82% odds.
 Initial capital of 1k, 60% confidence interval
Conclusion
We’ve covered a lot of ground in this tutorial: we’ve seen how to specify an all-or-nothing goal in terms of a step utility function, how the calculator picks from the available strategies to maximize our odds of achieving said goal, and how extending this problem framing to multiple periods can be used for long-term financial planning.
Though this post is getting quite long, we’ve only scratched the surface of what can be learned from this framework. A few ideas I’m hoping to write about some day:
- Switching from step to isoelastic utilities allows to model a desire for growth beyond just making ends meet.
- Switching to logarithmic utility can give a vivid picture of how our earning and spending affects our risk capacity, and how far most of us are from being able to be true Kelly investors.
- Introducing riskier strategies and borrowing into the model one can verify the thesis from Ayres and Nalebuff’s lifecycle investing - that leverage is indeed desirable for young people low on financial capital.
- Playing with safe withdrawal scenarios can help get some firsthand experience with the effects of volatility drag.